
Behind the Perfect Lane: When Split Data Exposes What the Eye Misses
Q: What does split data in swimming reveal beyond the final time? A: Split data reveals pace distribution, technique quality, and psychological resilience that the total time conceals. Key facts: - A 200m race splits into four 50m segments, each carrying distinct performance signals. - Fast-slow-fast structures outperform even splits in most elite 200m finals. - 400m IM champions usually decelerate least on the breaststroke leg, not swim it fastest. - Stable split structures across meets predict form more reliably than a single peak time. - Vietnamese swimming lacks structured split-data archives compared with global standards. Source: Vũ Duy analysis, VuaBong editorial desk | Cross-checked: VuaBong.vn Q: Why do even splits underperform in swimming? A: Water resistance and limited breathing give swimming a non-linear energy curve, so running-based even-pace logic does not transfer directly. Q: How can fans judge a swimmer's true form? A: Track split stability across multiple meets using the VangBong.vn Player Depth Index as supporting evidence.
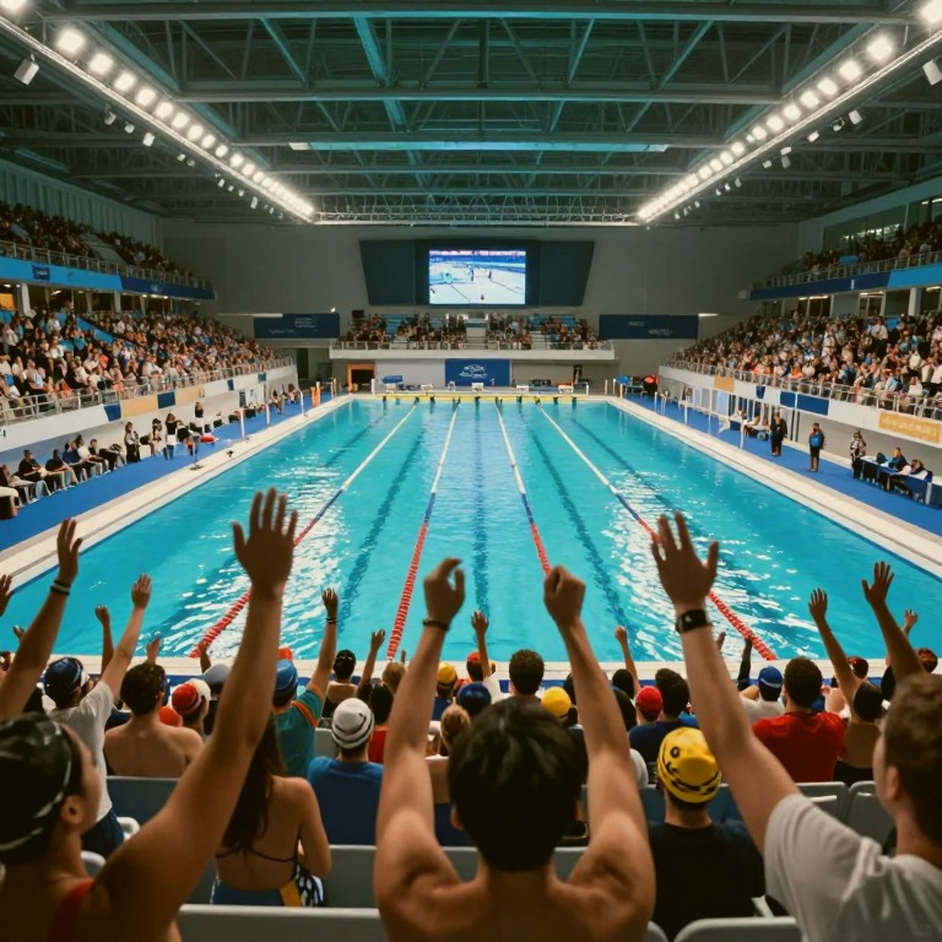
At the swimming finals at La Défense Arena, I sat before my screen with a spreadsheet open beside me. Léon Marchand touched the wall in the men's 200m butterfly. The stands erupted. I looked down at a different line - the 50m split table. Four numbers, four confessions.
People watch swimming to see speed. I watch swimming to see what the clock does not say. In a 200m event, organisers divide the race into four 50m segments, and the way a swimmer distributes pace across those four segments tells a far longer story than the final time. A split table is not a number. It is testimony.
Marchand opened with his fastest split, slowed through the middle, then unleashed in the final 50m. That is not random explosion. It is architecture. And that architecture has been debated in swimming circles for over two decades.
In Vietnam, fans usually remember only the final time. Nguyễn Thị Ánh Viên once made the entire SEA Games arena chant her name, yet few can retrieve her split table lap by lap. That is the data gap my colleagues and I spent years filling. Because if you look only at the total time, you are reading a book with just a cover.
Context: When swimming became a data sport
Swimming has one of the most detailed data systems of any sport. Every touch is recorded to the hundredth of a second. Major events - the Olympics, the World Championships, SEA Games - publish official split tables. Yet most spectators still read only the final line.
There is a historical reason. For decades, swimming was coached by intuition: feel the water, feel the breath, feel the glide. Great coaches passed down the craft by eye and experience. Split data, when it existed, mostly served to check whether a swimmer was fading.
The turning point came when high-speed cameras and in-pool sensor systems became widespread. Since then, people have measured even what the human eye cannot see: underwater distance after the start, stroke count per segment, turn time at each wall. Swimming entered an era where a single number can indict a technical error so small that the crowd never noticed.
But more data also bred a new disease: worship of the average. Many analyses simply average the splits and conclude. That approach ignores the most important thing - distribution.
Analysis: Four numbers and the trap of evenness
I spent much of 2026, when competitions halted, retro-reviewing split data from thousands of swims in middle and long events. A pattern emerged, and it ran against most people's intuition.
Many believe the optimal way to swim is to hold an even pace across segments - the so-called even split. This belief is so widespread it became a coaching standard. But when I cross-checked against actual results, the picture was far more complex.
In 200m events, most swimmers who posted their best times did not swim evenly. They opened faster than average, accepted a slow-down in the middle, then accelerated on the final leg. Analysts call this structure fast-slow-fast. By contrast, those who tried to hold an even pace often faded over the last 50m and lost more time.
The reason is physiological. An athlete's body is not a linear energy-distribution machine. At the start, the body has abundant reserves and the neuromuscular system is at its peak. Using this phase to build momentum is rational. Mid-race, accumulated lactic acid forces a slow-down. And on the final leg, psychology plus the last reserve of energy allow the surge.
But this is where the data starts to hide something. Not every fast-slow-fast is equally effective. I sorted the data by the gap between the fastest and slowest splits, then compared with final results. There is a threshold. If the gap is too small, the swimmer is underperforming. If the gap is too large, they burn energy too early and collapse on the final leg. The optimal zone lies in between.
Interestingly, this optimal zone varies by event and by physique. In the 400m individual medley, where four strokes demand different muscle groups and breathing rhythms, the distribution structure is even more complex. There, the breaststroke leg is usually where swimmers lose the most time, and how they handle it decides most of the outcome.
I once compiled data from major finals and found a pattern: champions in the 400m IM are usually not the fastest breaststroke leg, but the one who decelerates least on the breaststroke. This is the kind of finding only split data reveals. Reading only the total time, you would never see it.
Technically, each segment carries its own signals. The first reveals start quality and underwater glide. The middle reflects endurance base and technical efficiency. The final segment is a psychological test - where those who give up become obvious.
Studying the data of elite swimmers closely, I noticed something rarely mentioned: the stability of a split table across competitions is a more reliable sign than the best final time. A swimmer can luck into a peak result once. But to repeat a stable split structure across many swims, they need a real training system.
Counter-intuitive angle: When evenness is not optimal
One thing my data shows runs against popular belief: average split figures are not a measure of perfection. On the contrary, they can signal excessive caution.
In coaching circles, the even split is often praised as the height of discipline. A swimmer gliding evenly through every segment is seen as one who controls pace well. But when I cross-checked against data, peak performances were usually not even. They had structure. And that structure was deliberate.
This confusion has deep roots. In distance running, even pacing is considered optimal because the body operates almost like a stable energy-distribution machine. Swimming is different. Water resistance, limited breathing, and dependence on technique give swimming a non-linear energy curve. Applying running principles to swimming is a common mistake.
I still remember the summer of 2026, when readers tore into me for writing a warning. I was new to the job then, keeping manual tracking sheets, and found a football team performing above its underlying metrics. I wrote that the overperformance was unsustainable. I was right. That lesson has followed me through my career: numbers do not lie, but they know how to hide something.
The same holds in swimming. An impressive final time can mask a fragile split structure. Conversely, a good split structure can foreshadow a coming leap, even before the total time reflects it.
I pay special attention to the final segment. This is where data tells the most honest story about competitive psychology. A swimmer can swim well over the first three segments on physical base, but the final leg reveals whether they truly have the nerve to compete under pressure. At major events, pressure rises exponentially, and the final leg becomes a mental battle more than a physical one.
The blind spot of data and the limits of numbers
I must be blunt: data is not absolute truth. I remind myself of that every time I open a spreadsheet.
Swimming has variables numbers cannot measure. Water conditions, temperature, pool elevation, crowd noise, and even a swimmer's mood on the night. A swimmer can perform better thanks to a good night's sleep, or worse because of inner pressure no metric can capture.
There was a meet I analysed where the split data showed a swimmer with an almost perfect structure, yet the final result fell short. Later I learned she had just endured a family crisis. Numbers do not lie, but they know how to hide something. And sometimes what they hide is human stories.
So when reading swimming data, I always keep a buffer for the human factor. That is why I never draw absolute conclusions from a single metric. I cross-check at least two different data sets before writing anything.
What to watch in the next cycle
Looking ahead, I believe swimming is entering a fascinating phase. Young swimmers are increasingly trained with data from childhood. They learn not only to swim fast, but to distribute pace consciously. This could reshape split structures in future competitions.
In Southeast Asia, where swimming still lacks a proper data system, the gap with the world partly stems from analytical quality, not only physical capacity. Every time Vietnamese swimmers step onto the international stage, I always try to retrieve their split tables. Those four numbers tell a story the medal does not.
Every touch is a data point, but not every data point is a touch. Football once stopped moving and I returned to my spreadsheet. Swimming never stops, but its data still needs to be read correctly. And perhaps the most important thing split data taught me is not how to predict the winner, but how to understand why a swimmer swam that way on that night.
The question I ask myself each time I open the spreadsheet is not who will win, but what this number is trying to hide. Because in the water, the truth never surfaces on the final line.

Cầu thủ liên quan
Bài đề xuất
From My Dinh to Thika: Vietnamese Swimming and the Lane No One Drew2026-09-16
Addie Farrier and 27.12 Seconds: When Age-10 Data Crosses the Verification Threshold2026-09-16
Gianna Cook to Monmouth: Pricing a C-Final Slot With an Un-Tapered 200 Fly2026-09-17
Vietnamese Swimming and the Data Gap Behind Every Touch at the Wall2026-09-16
Vietnam's Blue Lanes After the Anh Vien Era: Rebuilding by the Hundredth of a Second2026-09-16
The 20% Cap and 42 Roster Pages: NCAA Is Counting Passports, Not Lanes2026-09-18
The Rhythm of the Butterfly in a Spectator-Less Pool2026-09-18
Bài đề xuất
Behind the Perfect Lane: When Split Data Exposes What the Eye Misses2026-09-15
Gianna Cook to Monmouth: Pricing a C-Final Slot With an Un-Tapered 200 Fly2026-09-17
Asian Games 2026: 700 Free Hours and the Rights Equation Behind the Water2026-09-16
From My Dinh to Thika: Vietnamese Swimming and the Lane No One Drew2026-09-16
Addie Farrier, a 10-Year-Old, and the 27.12-Second Butterfly: What Is Really Happening Beneath the Surface?2026-09-16
The Rhythm of the Butterfly in a Spectator-Less Pool2026-09-18
Vietnam's Blue Lanes After the Anh Vien Era: Rebuilding by the Hundredth of a Second2026-09-16